
Energy markets are fast-moving, data-heavy, and influenced by everything from geopolitics to weather patterns. For traders, utilities, procurement managers, and energy analysts, having the right tools to monitor prices and trends is not just helpful—it is essential for making informed decisions and managing risk effectively. With volatile oil, gas, and electricity markets, even small price swings can significantly affect profitability and operational strategy.
TLDR: Energy trading tools help market participants monitor price movements, analyze trends, and manage risk more effectively. From real-time data platforms to advanced forecasting and risk management systems, these tools provide critical insights for navigating volatile energy markets. By combining live market feeds, technical analysis, and predictive analytics, energy professionals can make faster and more informed decisions. Choosing the right mix of tools depends on trading style, asset focus, and risk exposure.
Below are six essential energy trading tools that help professionals monitor prices and identify actionable trends in oil, natural gas, power, and renewable energy markets.
1. Real-Time Market Data Platforms
Real-time market data platforms are the foundation of energy trading. These tools provide live price feeds for crude oil, natural gas, electricity, coal, and renewable energy credits (RECs). They typically include:
- Live bid and ask prices
- Volume data
- Futures curves
- Historical price charts
- Market news feeds
Traders depend on these platforms to stay aligned with market movements. For example, crude oil benchmarks such as Brent or WTI can react instantly to geopolitical events or supply disruptions. Without real-time access, traders risk acting on outdated information.
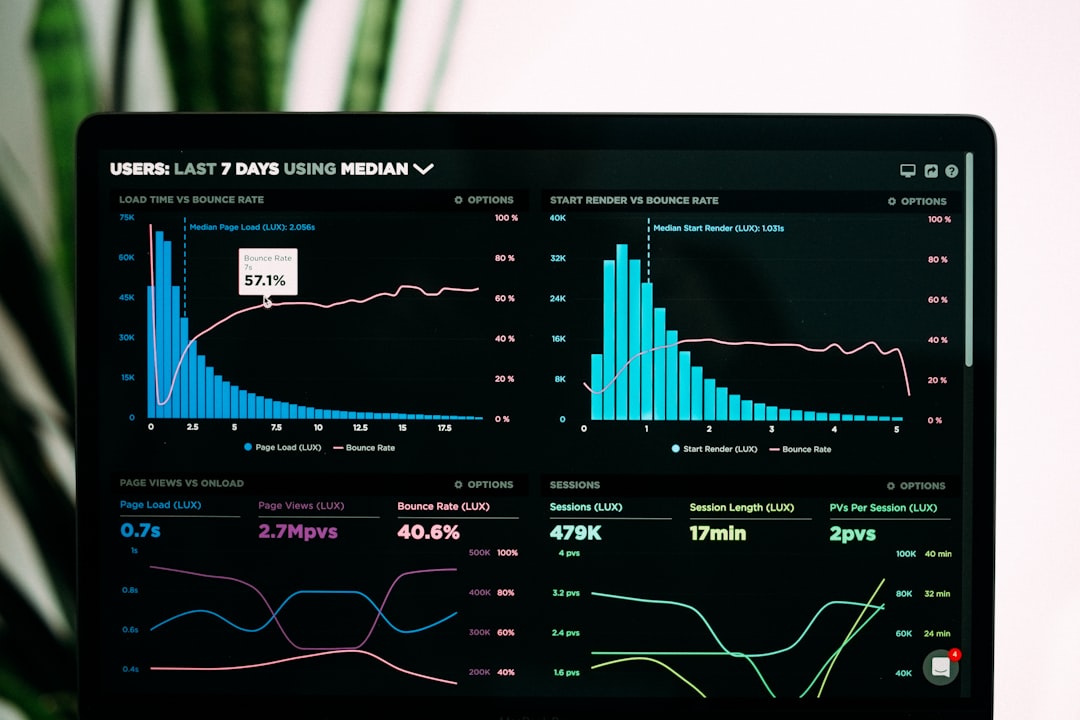
Modern platforms often allow full customization of dashboards, enabling users to track specific contracts, spreads, and regions. Users can set alerts based on price thresholds or volatility spikes, allowing them to respond quickly to market shifts.
Why it matters: Real-time accuracy ensures traders react to developments as they happen, reducing execution lag and missed opportunities.
2. Advanced Charting and Technical Analysis Software
Technical analysis plays a key role in identifying trends and entry or exit points. Advanced charting software enables traders to visualize price data in multiple forms, including candlestick charts, moving averages, Bollinger Bands, Relative Strength Index (RSI), and MACD indicators.
These tools help energy traders:
- Detect trend reversals
- Identify support and resistance levels
- Monitor momentum shifts
- Analyze volatility patterns
For instance, seasonal trends in natural gas prices often correlate with weather expectations. Charting tools make it easier to identify patterns linked to cold winters or hot summers.
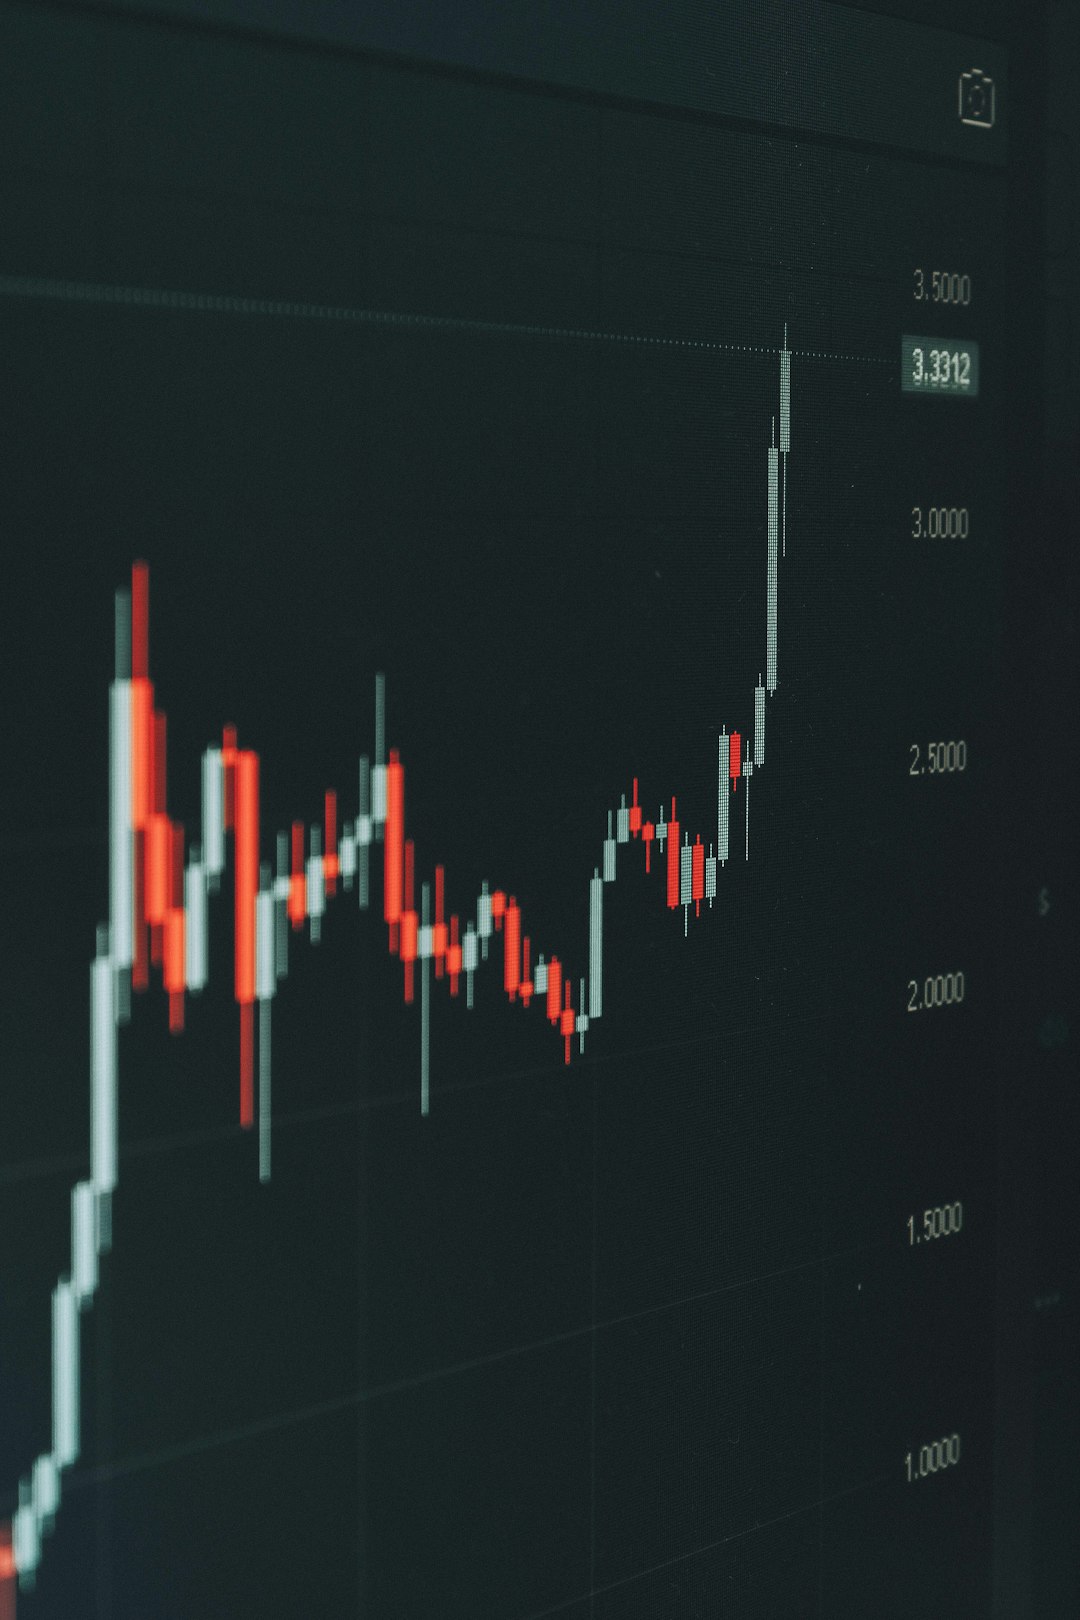
Many platforms allow backtesting, enabling traders to test strategies against historical data before implementing them in live markets. This reduces emotional decision-making and increases strategic consistency.
Why it matters: Visualizing price action helps traders understand market psychology and improves timing precision.
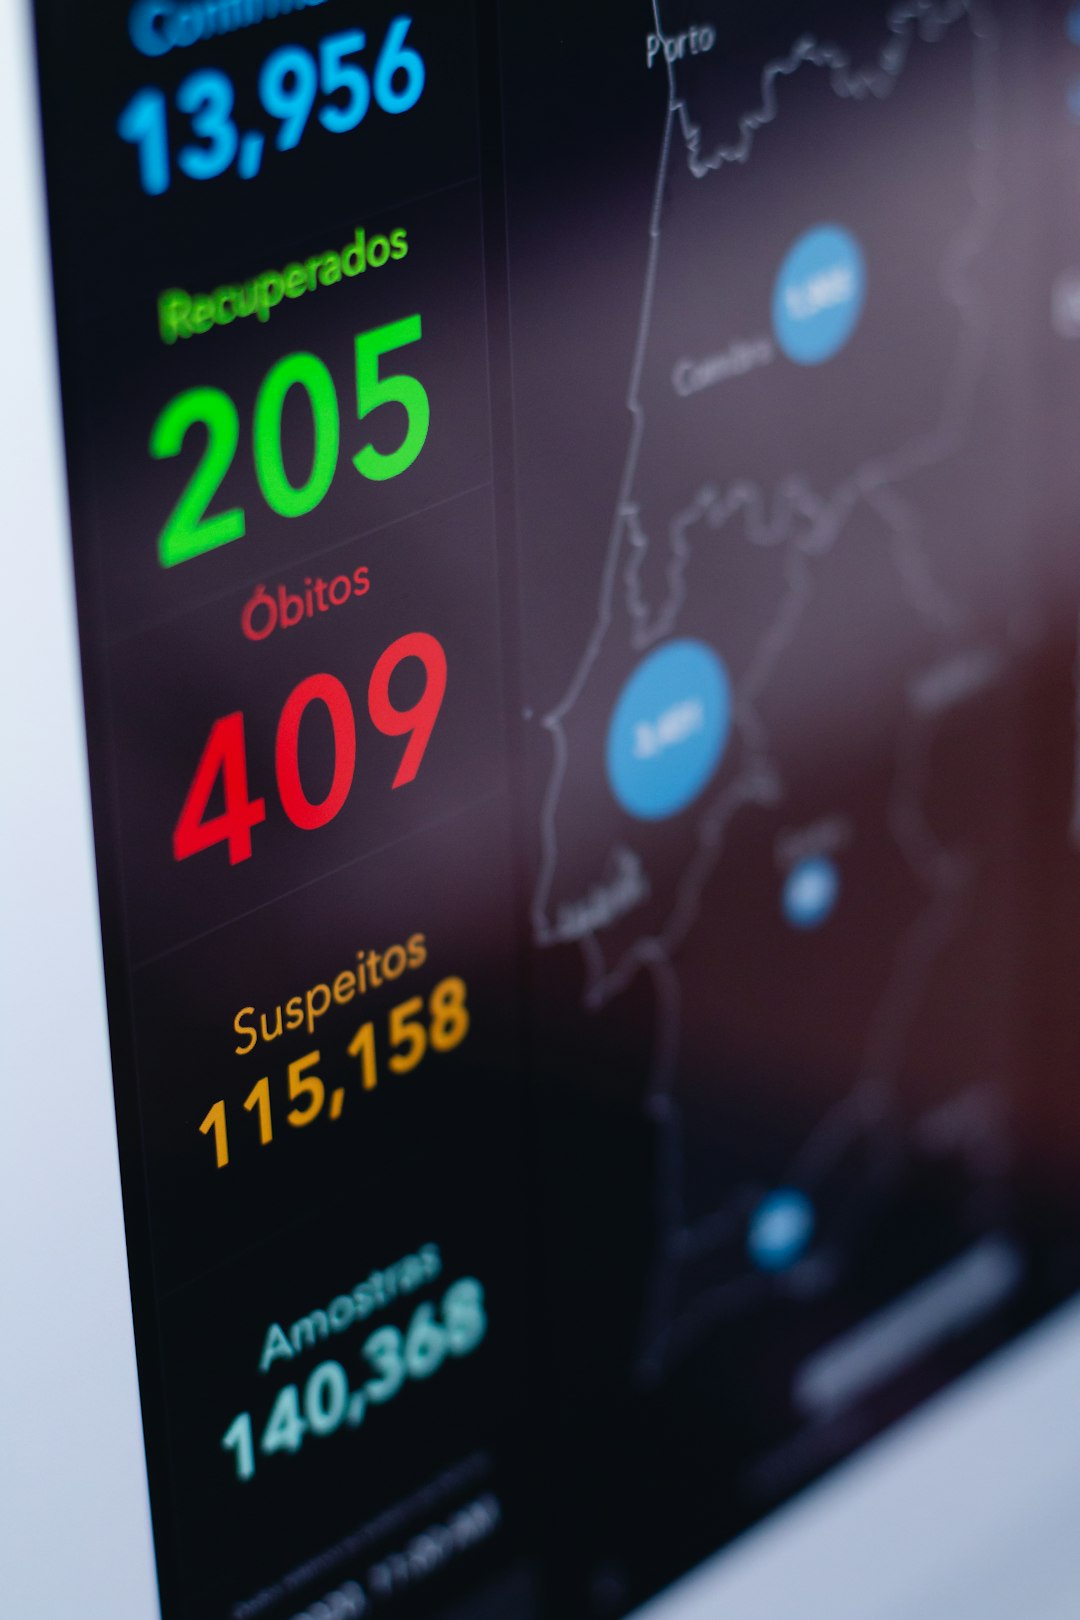
3. Fundamental and Market Intelligence Platforms
Energy markets are deeply influenced by supply-demand fundamentals, geopolitical developments, infrastructure constraints, and regulatory changes. Fundamental data platforms aggregate information such as:
- Inventory reports (e.g., crude oil and gas storage data)
- Production statistics
- Rig counts
- Weather forecasts
- Economic indicators
- Policy and regulatory updates
This data gives traders context beyond price charts. For example, an unexpected drawdown in crude oil inventories may drive bullish sentiment, even if technical indicators suggest consolidation.
Energy traders often use these tools to prepare for scheduled releases, such as weekly petroleum status reports or monthly OPEC statements.
Why it matters: Combining fundamental data with price analysis offers a more comprehensive view of market direction.
4. Risk Management and Exposure Monitoring Systems
Price monitoring alone is not enough. Professional traders and energy companies must also understand their exposure. Risk management systems track positions, profit and loss (P&L), margins, and Value at Risk (VaR).
Key capabilities include:
- Portfolio-level exposure tracking
- Scenario analysis
- Stress testing
- Hedging simulation tools
For utilities or manufacturers hedging long-term fuel needs, exposure monitoring ensures that hedge ratios remain aligned with consumption forecasts. Traders can also simulate market shocks—such as sudden oil supply disruptions—to estimate potential losses.
Why it matters: Effective risk management prevents small price moves from escalating into significant financial losses.
5. Algorithmic Trading and Automation Tools
Algorithmic trading platforms allow users to automate trading strategies based on predefined rules. These systems monitor market data constantly and execute trades when certain conditions are met.
Common uses include:
- Spread trading automation
- High-frequency execution
- Arbitrage detection
- Statistical modeling
In fast-moving electricity or gas markets, automation can capture opportunities that manual trading might miss. Algorithms also help reduce emotional trading by enforcing disciplined strategies.
These tools often integrate with real-time data feeds and technical indicators, creating rule-based trade triggers.
Why it matters: Automation enhances speed, consistency, and scalability in energy trading operations.
6. Forecasting and Predictive Analytics Platforms
Forecasting tools use historical data, machine learning, weather modeling, and economic forecasts to predict future price movements. These systems are particularly valuable in power and renewable energy markets, where supply depends on weather conditions.
Predictive analytics tools can forecast:
- Electricity load demand
- Wind and solar generation output
- Seasonal fuel demand
- Price volatility probabilities
For example, forecasting platforms may predict a spike in electricity prices due to extreme heat driving up air conditioning demand. Traders and grid operators can then adjust procurement strategies accordingly.
Why it matters: Anticipating future trends helps market participants position themselves before prices move.
Comparison Chart of Energy Trading Tools
| Tool | Primary Function | Best For | Key Benefit |
|---|---|---|---|
| Real-Time Market Data Platforms | Live price and volume tracking | Active traders | Immediate market visibility |
| Technical Analysis Software | Charting and indicators | Short to medium-term traders | Trend identification |
| Fundamental Data Platforms | Supply-demand insights | Strategic analysts | Contextual decision support |
| Risk Management Systems | Exposure and P&L tracking | Companies and portfolio managers | Loss mitigation |
| Algorithmic Trading Tools | Automated strategy execution | High-frequency and advanced traders | Speed and consistency |
| Forecasting Platforms | Predictive modeling | Long-term planners | Proactive positioning |
Choosing the Right Combination of Tools
No single tool provides a complete picture of the energy market. Most professionals combine several systems to create a layered decision-making approach. For example:
- A trader may use real-time data plus technical charts.
- A utility company may combine forecasting tools with risk management systems.
- A commodity fund might integrate fundamental data, automation, and exposure monitoring.
The optimal setup depends on market exposure, trading frequency, and risk tolerance. Regardless of role, the goal remains the same: to monitor prices efficiently and recognize meaningful trends before the broader market reacts.
FAQ
1. What is the most essential tool for energy traders?
Real-time market data platforms are generally considered the most essential because they provide live pricing and immediate insight into market movements.
2. Are technical analysis tools useful in energy markets?
Yes. Energy markets display recurring price patterns and volatility cycles, making technical analysis helpful for identifying trend shifts and optimal trading entries.
3. Why is risk management software important?
Energy markets are highly volatile. Risk management tools monitor exposure, calculate potential losses, and run stress tests, helping organizations protect capital.
4. How do forecasting tools differ from technical analysis?
Technical analysis focuses on historical price data and chart patterns, while forecasting tools use predictive models, weather data, and economic inputs to estimate future conditions.
5. Can smaller companies benefit from these tools?
Yes. Many modern platforms offer scalable solutions suitable for independent traders, small utilities, and mid-sized businesses.
6. Do energy traders typically use multiple tools at once?
Absolutely. Combining data feeds, charting software, risk management, and forecasting tools allows traders to create a more comprehensive and balanced trading strategy.
In an environment defined by rapid change, uncertainty, and global interconnectedness, energy trading tools provide the clarity professionals need to monitor prices and identify meaningful trends. With the right technology stack, market participants can move beyond reactive trading and toward strategic, data-driven decisions.
